
Product Releases
Sep 30, 2026
How CRE Operators Prove ROI From Building Operations Software
Five steps to go from "it feels valuable" to a business case your buying committee approves.
Strong portfolios are built on clear visibility. That starts with knowing which KPIs to follow.

High-performing commercial real estate firms are rethinking what it means to track performance.
Research from JLL frames this as a shift from value creation to value measurement: going beyond traditional commercial real estate metrics to establish a direct connection between daily operations and business objectives, one that requires reinforcing an ROI culture, linking CRE performance directly to business objectives, and building a data-driven decision-making culture where teams track the metrics that connect operations to portfolio outcomes.
The property management KPIs worth following are the ones that explain how your portfolio performs and why. Can you confidently say that the corporate real estate KPIs your team follows right now are doing just that?
For most CRE property management teams, the answer starts with getting the right mix of financial and operational real estate KPIs on the dashboard.

Net Operating Income is the baseline property KPI in commercial real estate, measuring a property's profitability after operating expenses and before debt service or capital expenditures.
NOI = Gross Rental Income + Other Income - Operating Expenses
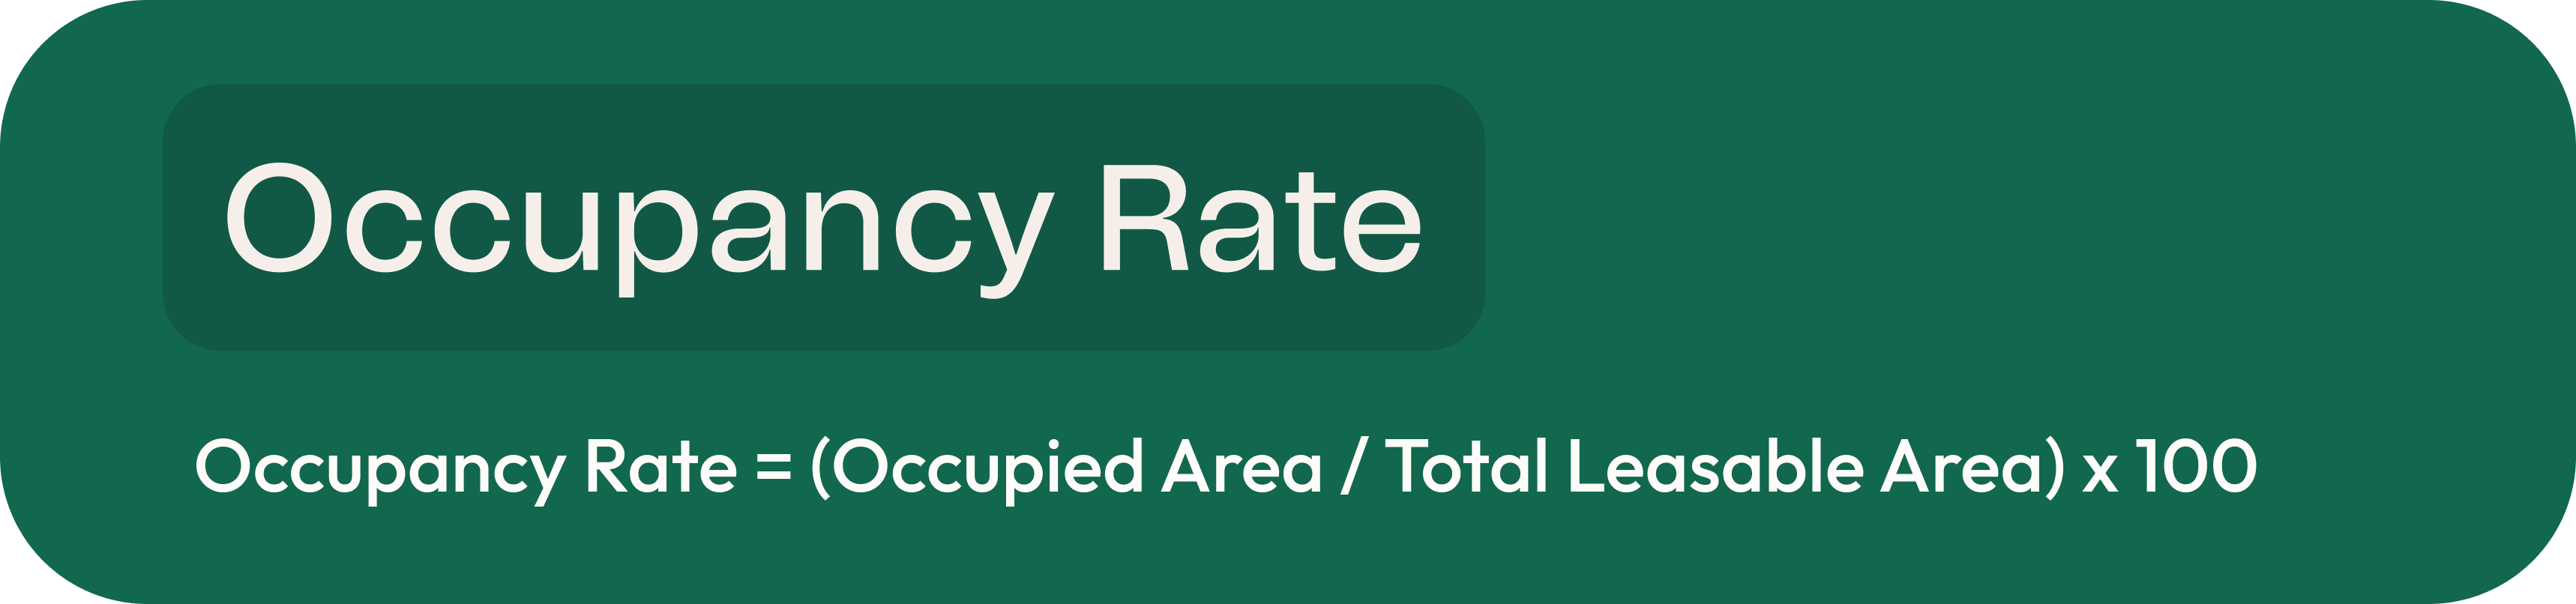
Occupancy rate measures the percentage of leasable space currently occupied by paying tenants, one of the most direct real estate KPI examples for assessing portfolio leasing health.
Occupancy Rate = (Occupied Area / Total Leasable Area) x 100
*** Not to be confused with space utilization rate, which measures how effectively occupied space is actively being used. Due to widespread hybrid work schedules and varying mid-week peak attendance, this metric should benchmark at 45–65% in 2026.

Cap rate is a key KPI for real estate management decisions, expressing the ratio between a property's NOI and its current market value to compare risk and return across assets.
Cap Rate = (NOI/Current Market Value) x 100

OER compares total operating expenses to gross operating income, showing how much of a property's revenue goes toward keeping building operations running.
OER = Operating Expenses/Gross Operating Income

Lease renewal rate tracks the percentage of expiring leases that renew in a given period, making it one of the most consequential financial key performance indicators in real estate for income stability.
Lease Renewal Rate = (Renewed Leases / Expiring Leases) x 100

Tenant retention rate measures the percentage of tenants who remain across a portfolio over a given period, connecting tenant experience and day-to-day operations directly to revenue stability.
Tenant Retention Rate = (Tenants Retained / Total Tenants) x 100
*** Not to be confused with tenant satisfaction score, which is collected via periodic surveys and measures how tenants experience the building environment. Property managers tracking this through standard client feedback frameworks consider a Net Promoter Score (NPS) above 50 to be an exceptionally strong benchmark for commercial portfolios in 2026.
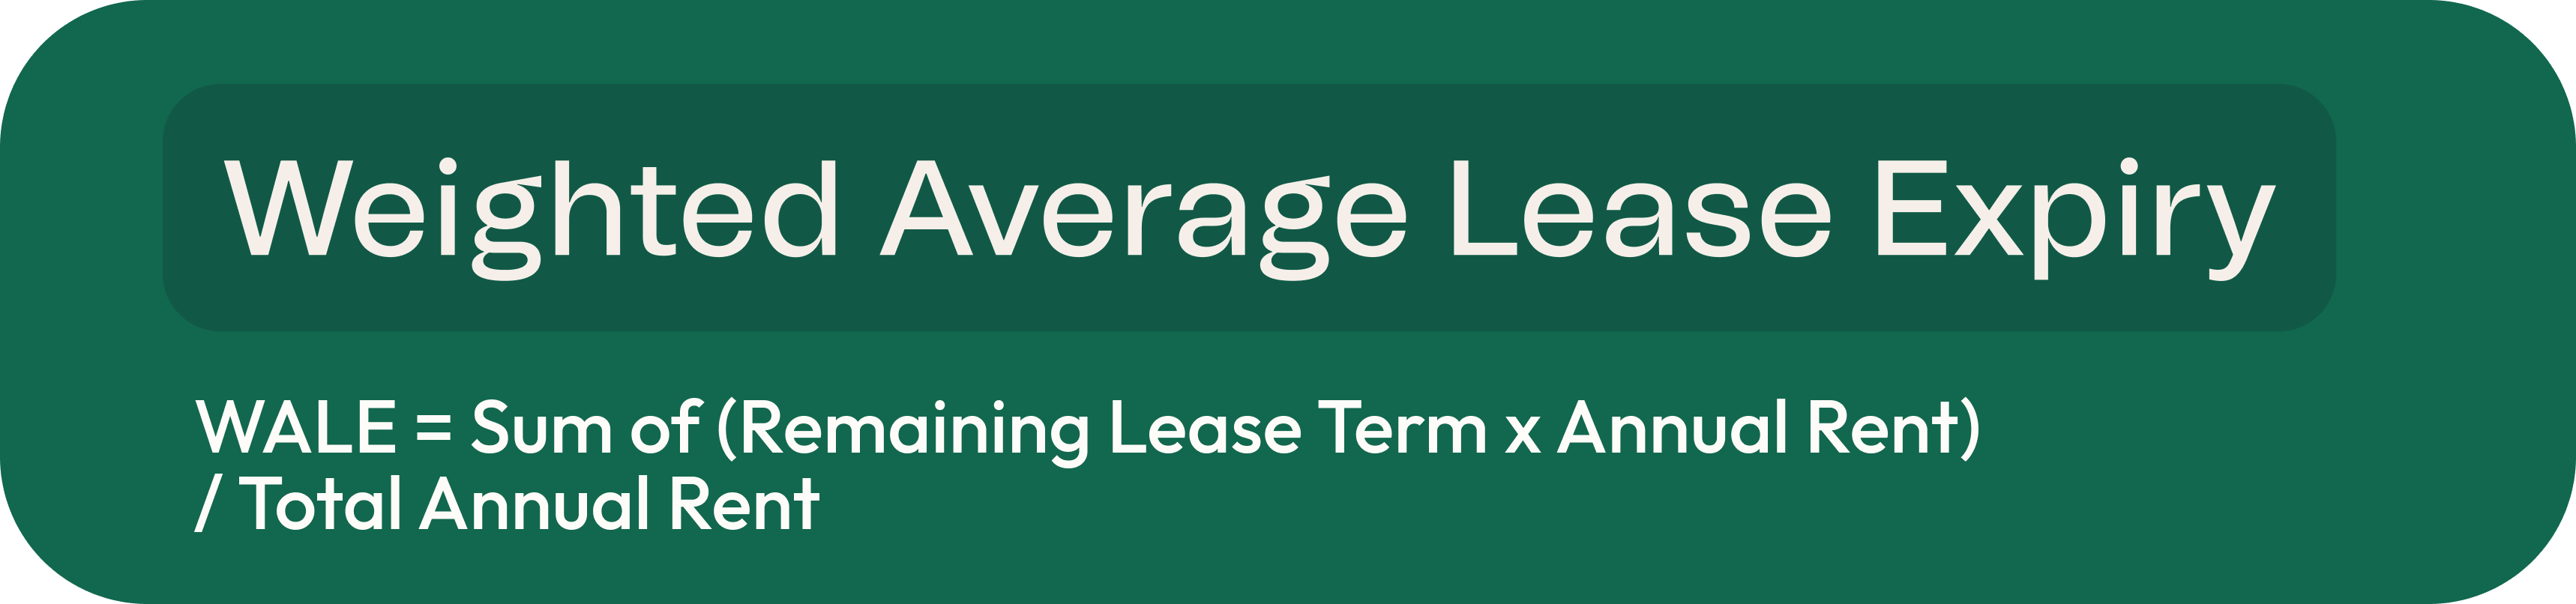
WALE measures the average time remaining across all leases in a portfolio, weighted by each tenant's rent contribution. This gives lenders and investors a read on income stability.
WALE = Sum of (Remaining Lease Term x Annual Rent) / Total Annual Rent

Maintenance cost per square foot connects total maintenance spend to leasable area, giving property managers a consistent way to benchmark commercial property maintenance performance and vendor cost across a portfolio.
Maintenance Cost per Square Foot = Total Maintenance Spend / Total Leasable Area
Work order resolution time measures how quickly service requests move from submission to completion, connecting the work order management process to tenant satisfaction and asset condition.
*** Not to be confused with preventive maintenance completion rate, which measures the percentage of scheduled maintenance tasks completed on time. To maintain world-class facility operations and prevent deferred maintenance backlog, this should consistently benchmark at 90%+.
Visitt is built around one principle: commercial real estate metrics are only as useful as the platform surfacing them. Visitt's operations dashboards consolidate financial and operational real estate KPIs across every property in the portfolio, giving operators and asset stakeholders a shared, real-time view of the performance signals that affect tenant retention, cost control, and long-term asset value.
With AI property management software continuously analyzing trends across properties, a rising maintenance cost per square foot or a gap in COI compliance is surfaced before it becomes a liability. Ready to benchmark every real estate KPI in one place? Talk to our team and explore how we can work together.
Real estate KPIs are measurable signals that translate operational activity, tenant behavior, and financial outcomes into consistent metrics CRE teams can review and compare across properties and reporting periods. They give portfolios a shared language for evaluating performance over time.
Teams use KPIs to benchmark assets against market performance, connect service delivery to tenant retention, manage vendor and maintenance spend, track compliance and sustainability progress, and guide acquisition and reinvestment decisions. The most effective KPI programs consistently cover all of these areas.
Financial KPIs like NOI, OER, and cap rate measure what a property earns and what it costs to run. Operational KPIs like work order resolution time and preventive maintenance compliance rate show how the building is being managed day to day.
Operational KPIs like work order resolution time and inspection completion rate are worth reviewing weekly. Financial KPIs like NOI and OER fit a monthly cycle. Lease renewal rate and cap rate are better evaluated quarterly, when trends have enough data behind them to be meaningful.
Most commercial portfolios target 90 to 95 percent occupancy. The more useful metric is how your rate trends against your submarket average over time. A property at 91 percent and climbing tells a different story than one at 95 percent and declining.


Insights, trends, and practical ideas for smarter commercial real estate operations.

Discover how Visitt transforms operations and tenant
experience, portfolio-wide.